
I’m going to start talking about monetary policy today, and continue with it in the next lecture, and again next week.
So think about the Federal Reserve, and their decisions directed to monetary policy. They have just met, and decided not to change anything, but they are looking ahead to March to see if they will raise rates as they did in December.
They know where the economy is, and where it has been, and infer where it is going in order to decide to do something to nudge it in one way or another. So I have handed out a sheet, a bit of information certainly used by the Fed, and the investment community in trying to decide what are they going to do.
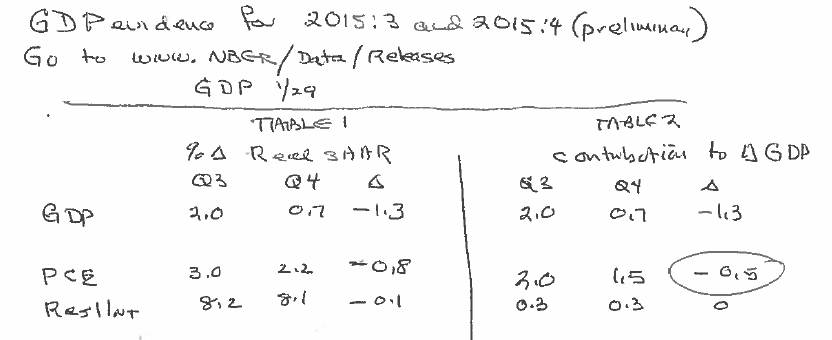
Table 1 on the left hand side of the sheet shows what happened to GDP and its components in the last two quarters, based on what was released on January 29th. Table 2 on the right hand side shows the contribution of each component to the change in GDP.
The Fed likes to say that they have a plan, but what they actually do is data dependent and they are adjusting policy accordingly. Here is one example of new data, and we have to recognize that there are problems with actually measuring real GDP.
What do I learn from these numbers? And if I were at the Fed I would have to recognize measurement problems in trying to interpret them.
First, what does it mean to say GDP rose by 0.7% in Quarter 4, as suggested by the first line of Table 1? That GDP growth fell from 2% to 0.7%? Well, we should recognize that these numbers are expressed as an annual rates. Be careful, not all countries do this. To say that GDP increased by 0.7% (seasonally adjusted), doesn’t tell you what happened over the quarter. Rather this number tells you what happened on average in this quarter compared to last year.
This number came out last week: it is months and months old.
You see the components in Table 2, and based on this you ask yourself what the meaning of all this is. Why did consumption expenditures slow down? We don’t know. It is surprising because energy prices were falling, and we’d expect this to increase consumer expenditures. But this development messes up the interpretation of these data because in the energy sector prices have fallen to the point it doesn’t pay to be in business, and many business stop drilling and fracking and close up shop. But this slowdown spreads beyond just the oil industry, affecting jobs in the pipe making industry, and incomes of workers in other sectors beyond just oil. And look around, other countries have slowed own, Canada has slower growth.
It’s complicated, and this makes setting monetary policy difficult. The Fed is looking in a rear view mirror. But also we get data from time to time from other sources, not just the quarterly GDP. For example on Friday [February 5th, 2016] we will get the official employment numbers, and you will have a chance to see that and put it in the context of all the other numbers. Go to http://www.nber.org/releases . [You can sign up for e-mail notifications of new releases], and if you do this you will be as knowledgeable as the Fed. On Friday after 8:30am you will be up to date with everything the Fed knows. [The link given in the handout is http://www.NBER/Data/Releases , but this doesn’t seem to work in my browser.]
Monetary policy
What we are seeing right now is a real revolution in monetary policy. We talked about fiscal policy, but when it stalled the Fed stepped in with unconventional policy. But right now I want to talk about conventional policy, because we are transitioning to that. So we need to know what this is about, and can then answer the question of why the Fed switched to unconventional policy, and is switching back again to conventional.
1. How does the process of monetary policy work?
The players are the Federal Open Market Committee, which consists of seven governors of the Fed. They are nice fellows with offices on Constitution Avenue, and who are appointed by the President. The chair is Janet Yellen, who taught here are Harvard, and actually taught with me some years ago. Also on the committee is Stan Fischer from MIT. This is a smart technical group of people with PhDs.
There are also 12 regional presidents on the Committee. All 7 governors get to vote, but only 6 of the regional presidents vote at any particular meeting. The Chair of the NY Fed always gets a vote, but the others rotate. The governors have a majority, but there is an attempt to seek consensus among all members.
The other important thing to know is that they are independent. What does it mean to say the Fed is independent? Well, in contrast to other government departments—say like the Department of Commerce or the Treasury—they are independent of the President. The president simply can’t call Yellen up and ask her to change interest rates.
Now in one sense they are not entirely independent since they are created by the Congress. But by tradition the Congress, though it likes to beat up on the Chairman whenever she comes to testify, respects the independence of the Federal Reserve in conducting monetary policy. In principle, though it could mandate policies.
2. How is conventional monetary policy made?
The Fed operates thorough the banks. All commercial banks are part of the system, and in addition so are the investment banks—players like Goldman Sachs , Morgan Stanley—who became members of the Federal Reserve system in 2008 to gain the advantages of the system. As a member bank you can borrow from other members, and also from the Fed, that is to say you can go to the “local window” and borrow. This was very important in the 2008 crisis.
All member banks are required to hold reserves, cash in vaults or deposits in the Fed that amount to 10% against checking accounts, though in the past they had to hold reserves against all deposits.
The members have to hold reserves to be able to meet demands for withdrawals. In addition, the commercial banks have to have capital that they could sell to raise funds. But the 10% reserve requirement is important. Until 2008 there was no interest paid against them. So this was an expensive requirement, and you either loaned them to another bank that wanted to expand its chequeable deposits, or you did something to expand your chequeable deposits by loaning to say Marty, who would deposit part of it, and kick off another round of lending to maintain the 10% requirement. [What he is trying to say is the reserve requirement is an important part of the money creation process, and that the private sector is an inherent part of that process. This can be a bit tricky if you are hearing it for the first time. You can get a bit more detail in these slides from my lecture on the topic in the course I give at the University of Ottawa.]
This provides the Fed with a tool to manage the aggregate volume of lending. By Open Market Operations it can control lending. “Open Market Operation” refers to the buying or selling short government bonds. If the Fed buys Treasury Bills, then it injects money into the system. By controlling the volume of reserves, the commercial banks would adjust total chequeable deposits to be at 10%.
This is history and the future, but it is not exactly today.
Just how do they do this?
Say if they want a guy like Marty to come and borrow more money, they have to lower interest rates. Short term interest rates are manipulated by selling short-term treasury bills, and manipulating deposits. If there are more deposits, then the only way there will be more lending is if rates are lower to increase the demand for loans.
The way to lower rates traditionally was through Open Market Operations: buy treasuries, inject cash. The actual mechanics of the operations are run by the New York Federal Reserve, who figure out how much treasuries to sell in order to hit the specified interest rate.
What are the advantages of using monetary policy over fiscal policy?
Monetary policy has five advantages over fiscal policy as a stabilization tool.
1. Shorter lags
There are both shorter decision and implementation lags in the use of monetary policy. As we discussed, for fiscal policy there are legislative lags. This is not a problem for the Fed. The committee meets regularly, even by telephone if they have to implement a change in policy quickly. There is no need to change legislation and involve the political process.
2. The ability to move in small steps
Monetary policy can be adjusted incrementally while learning about the way the economy is evolving. But fiscal policy doesn’t work this way. You need to put into place a plan, one piece of legislation that can’t be changed the next month. But the Fed can make month-to-month changes. They said in September that they expected to raise the federal funds rate four times in 2016, but they don’t have to do this. There will likely be a debate about this in March, that we as a class will join. The Fed also has the option of reversing direction quickly if new numbers suggest a mistake was made. The possibility of reversing direction quickly is another advantage.
4. Monetary policy is less political
In the conduct of monetary policy you don’t need the kind of agreement you might with a spending bill. The Fed is more neutral politically.
5. Fiscal policy is ambiguous
A stimulus may have the wrong sign [actually work in the wrong direction and make things worse]. For example, expectations of future rates may change the impact of fiscal policy if a higher deficit leads to expectations of higher interest rates and higher future taxes that have to be saved for in order to pay down. With monetary policy there is almost no ambiguity. If the Fed raises rates, the market will say the Fed has confidence in economic growth, inferring that the economy is strong. Raising rates may actually be stimulative. This is the only thing that is ambiguous.
Treasury bills are a year or less in maturity but many things in the economy depend upon longer rates: housing and mortgages, for example have, say, a 7 year horizon, and companies will release 5 year bonds.
So what is the link between short-term rates that the fed controls and long-term interest rates?
Long rates are an average of future short-term rates. If the Fed was 100% committed to raising rates 0.25% for four quarters, then this sets up an expectation of higher long-term rates. I would not want to hold long-term bonds with a lower rate right now. The key point is the long-term rate is the average expected future short rates. Changing short-term rates changes expectations of future short rates, and changes long rates.
The decision to hold long-term bonds also has a cost. Right now it is almost zero but if that becomes higher than demand for long-term bonds will fall and long rates will have to rise to balance demand and supply. The short rate is the cost of borrowing or the opportunity cost of holding long rates.
How interest rates influence aggregate demand
There are 9 ways in which short and long rates can influence aggregate demand.
Imagine an increase in rates
- Companies now have a lower incentive to hold inventories. With lower rates I can borrow to hold inventories, with higher rates this is more expensive.
- Fixed investment, long-term investment in equipment and structures are also more expensive with higher interest rates
- Housing construction and demand falls. Getting a mortgage depends upon earnings, obviously the higher the interest rate the higher earnings have to be to qualify for a loan. Higher rates preclude some people from the mortgage market. Interest rates play a role in what the banking system allows people to do.
- In a similar way, demand for consumer durables falls.
- Consumer nondurables are also reduced by higher rates. A large fraction of mortgages are variable rate mortgages so higher rates imply that more money is spent paying down mortgages and this lowers the spendable cash for other purchases.
- The stock market falls in value. Higher rates dampen stock prices. Every time there is a suggestion of higher rates the stock market takes a hit. This is not the only thing moving markets.
- The dollar rises in value. Basically higher rates relative to other countries increases the incentive to investing in the US, and this bids up the value of the dollar. A higher dollar lowers exports, and increases imports and this therefore reduces aggregate demand.
- Mortgage refinancing. If rates were lower this would lead to refinancing that frees up cash.
These are the nine ways. [What the heck, I only got eight of them.]
What is the Fed trying to do?
The Fed has a dual mandate: price stability, and maximum employment.
Price stability doesn’t mean stable prices, but this is Fed talk. It means price rises at a low positive rate of 2%. What price index do they use? Not the CPI (Consumer Price Index), which we all use, but rather the deflator for personal consumption expenditures in the GDP, which historically rises less than the CPI.
While in principle they are supposed to look at the total movement of this index, they actually look at the “core”: taking out energy and food prices. There is a lot of variability in food prices, they don’t care about the little wiggles in food and energy prices. They are interested in the core inflation rate, which is now 2.1%, which looks like it is on target.
Personal consumption expenditures deflation is 1.3 or 1.4%, and this is what of concern.
They did not always have a target. Bernanke wanted a target to focus expectations. It took him a while to get agreement. At first he talked about his “comfortable zone.” In other countries it is 2%, the magic number in Canada, New Zealand, and the UK.
The second mandate is maximum employment, and this is even harder to define: the maximum rate of employment consistent with inflation stability. They mean some unemployment number consistent with inflation not rising or falling. The unemployment rate is 5% (for college grads it is only 2.5%). This is a natural number to use, but should be tempered in our thinking because some people are not searching at all for a job. But in any case the unemployment rate at 5% seems to be it. Some even say 4.5% would be appropriate as a target.
How do lower unemployment rates translate into inflation?
When there is slack in the market, higher aggregate demand leads to an increase in both unemployment and inflation. But at full employment only to higher inflation. In practice the difficult question is how close are we to full employment.
Marty says we are at full employment, others say if that is the case why don’t we see wage inflation? Well the answer is that there are lags in the process. So how do economists pick up on this. Well we will look at that on Monday. Take a look at the employment numbers when they are released on Friday, and think about what you would think if you were Constitution Avenue.
