
 Let’s see if we can make sense of this.
UNICEF has just given Canada a passing grade, mind you barely a pass, when it comes to the fight against child poverty. In a report released today it claims that 21% of Canadian children live in poverty, nothing to brag about, but at least this is lower than the 23% who were poor just before the recession started in 2008.
Interestingly, Statistics Canada also says child poverty is down, but that only 8.5% of kids are poor. However, at the same time it says child poverty is up, reaching almost 14%. And finally, if this is not confusing enough, it says that, yes, 14% of kids are poor, but this is down since 2008.
Up or down? One-in-five kids poor, or one-in-seven, or maybe even as few as only one-in-eleven?
It would seem to make a difference, after all a whole generation of children has grown up during the 25 years since the House of Commons made an all-party commitment to “seek to eliminate child poverty by the year 2000.”
Well one thing is certain about the UNICEF report, the recession was met with no highly effective and targeted policies that would have contributed to a significant reduction in child poverty. The UN agency points to a couple of incidental Federal government initiatives that arguably have not influenced the well-being of poor families at all.
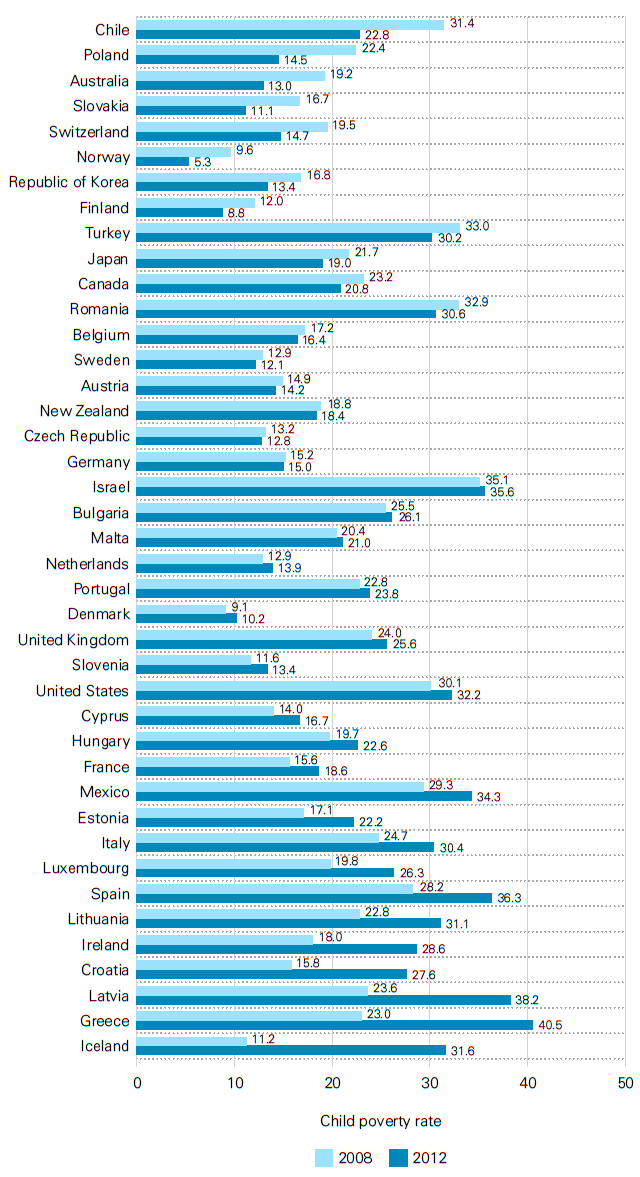
The report is also valuable because of the explicit comparisons it makes between as many as 41 countries. But this should be taken with a grain of salt as some comparisons are more informative than others. There is little to be learned from the fact that our child poverty rate is about the same as in Malta and Estonia, and somewhat lower than Bulgaria, or even from the fact that the child poverty rate changed very little, if at all, in the United States. Keeping child poverty in check is a major accomplishment because the recession was so much more severe in the US, that after all is why Americans call it the “Great Recession.”
A more instructive comparison for Canadians is with Australia, an economy that, like ours, was buffered from the sharp edges of the downturn by a resource boom. UNICEF associates the generous and targeted income support Australia made to lower-income families with a fall in child poverty from Canada-like levels of 20% before the recession, to as low as 13%.
The UNICEF definition of poverty is meant to facilitate comparisons of this sort, and their researchers consider children to be poor if their family resources fall below 60% of the middle—or so-called “median”— income. This is a frequently used European standard, and should be considered as measuring the degree of inequality in the lower part of the income distribution.
Agree or disagree with this definition, the point is that drawing a poverty line requires a value judgment to be made. There is no scientifically accepted method of drawing a distinct line, on one side of which our kids will be okay, but on the other they will not. Not being able to participate normally in society is what poverty means, but “normal” depends upon place, circumstance, and time.
There are three “normals” hard-wired into the different numbers Statistics Canada produces. A commonly used statistic is the “Low Income Cut Off,” and in this case normal means according to the behaviour and living standards of 1992, using the judgment and methods of statisticians from the 1960s. The second statistic is the “Market Basket Measure,” and in this case normal is defined according to the living standards of 2011 as determined by an intergovernmental working group involving the federal and provincial ministries of social policy. And finally, with respect to a third statistic called the “Low Income Measure”, normal is defined according to the standard of each year, a rule of thumb set at one-half of median income by a loose network of academics, and changing annually as median income changes.

This last statistic is consistent with the UNICEF findings, showing inequality in the lower part of the income distribution decreasing slightly, the Statistics Canada rate of 14.3% being lower than the UNICEF figure of 20.8% in part because 50% rather than 60% of median income is used as the crucial cut-off.
(UNICEF also, quite sensibly, fixed its line at the median income prevailing before the recession. Statistics Canada lets it change with each year, raising the possibility that poverty rates will not go up, and could even go down, during a recession. This would happen if the median income falls, and the poverty line as a result is lowered. What it means to participate “normally” in society certainly changes with time, but not so rapidly that it requires an annual updating, and certainly not during a business cycle downturn. Yet that is exactly what the Low Income Measure does, making it an unreliable indicator of business cycle changes.)
Canadians may wonder whether the standards prevailing in 1992—when many had not yet sent their first email, didn’t know what “world wide web” could possibly mean, and when a cell phone was something carried in a brief case—has relevance for what it means to participate normally in our society. Besides why 1992? Is this year chosen because Statistics Canada discontinued a survey that previously was regularly used to update this poverty line—the Low Income Cut-off—every five years? If so, this would seem like an entirely arbitrary value judgment. With each passing year, a decline in poverty seems an inevitable consequence of measuring it in this way.
But what of poverty in terms of the actual goods and services families need to function—a basket of goods including housing and clothing, a reasonably nutritious diet, a means of transportation appropriate to their community, and reasonable access to other goods that Canadians use to lead a “normal” life—all measured in terms of the society that we currently live in? Of the three statistics, the Market Basket Measure seems to be most reasonable to gauge recent developments. It shows that more than 1 in 7 Canadian children live in families with insufficient incomes to afford such a basket. And it also shows that the child poverty rate increased during the recession.
The UNICEF report has documented that inequality in the lower half of the income distribution has fallen slightly in Canada, and a similar Statistic Canada number lends confirmation. But this statistic is useful for comparisons to some countries with roughly similar living standards, and where the nature of the challenges were roughly the same. Comparisons of this sort imply that UNICEF is saying things could have improved much more by concerted public policies that made children a priority.
A little more than a decade ago I was the researcher coordinator of the child poverty report UNICEF released in 2005. It was pretty clear to the project team that ranking countries, and inviting comparisons between them, is a valuable communications device, but only a first step in thinking about the issue. Comparisons are sometimes appropriate, and sometimes not.
UNICEF has once again make effective use of that device. By forcing us to look at others, it encourages us to look more closely at ourselves, and ask whether things are getting better or worse according to the standards by which we live. The appropriate Statistics Canada numbers suggest that child poverty rates actually increased during the recession, and by implication that a commitment made 25 years ago continues to go unfulfilled. Hardly a passing grade.

Reblogged this on Ainslie Cruickshank.
Agreed country to country, agency to agency comparisons are fraught with land mines for analytical purposes. Lets just focus on Canada, although I must say the child poverty reduction policies in the Czech and Slovakia states merit review. And 19% child poverty in Switzerland?
Where does child poverty exist in Canada throughout? Or perhaps in targeted regions and communities, We know that higher birth rates in most aboriginal communities exist and that these often remote communities do not necessarily have access to, or are part of, the western capitalist economy by which our metrics are designed. Secondly, many of our national and provincial policies impose limitations on immigrants meaning that they have lower earning power and access to employment that in their countries of origin they would have had. This impacts their children. So from a national and prov/terr front policies that assisted and aided these two communities could positively impact our child poverty numbers come say 2020. Better ask the Lib/NDP minority gov’t to get working on those ideas.
Greg Finnegan, Yukon
Reblogged this on Perceptive Insight and commented:
Who defines poverty? And how? Poverty is a real problem, but unless we are very deliberate and careful in defining and measuring it, we can end up with inaccurate information regarding the full extent of poverty.