

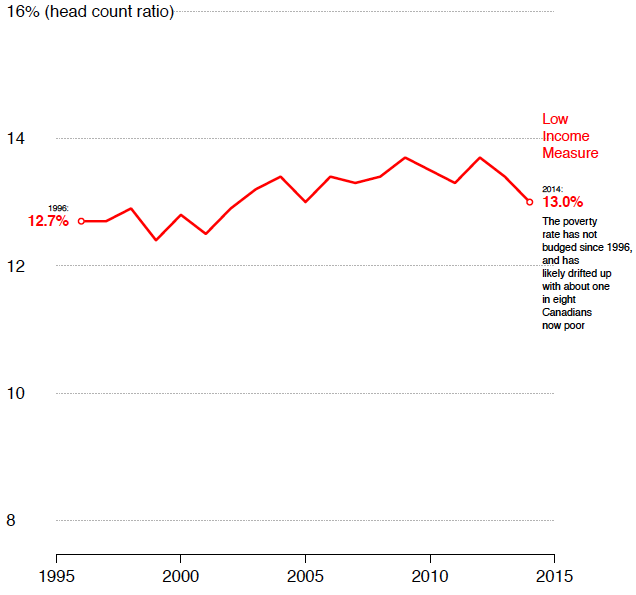
The two most commonly used poverty rates produced by Statistics Canada tell very different stories. The patterns are curious, and confusing. The two statistics—the poverty rate according to the Low Income Cut-off and that according to the Low Income Measure—track each other rather closely up to the early 1990s, then diverge quite markedly as the Low Income Cut-off falls steadily to an unprecedented low, while the Low Income Measure drifts upward. Which statistic should we believe?
The cyclical patterns also differ, with the Low Income Measure registering higher poverty during recessions only before the 1990s, and in a way that is more muted and lagging the movement in the Low Income Cut-off. It also signals a rise in poverty only well after the onset of the 1990/92 recession, and both measures show no upturn in poverty during the Great Recession, which began in 2008 and led to a significant fall in employment.
For something that is central to so many policy debates, the Canadian “poverty” rate is notoriously confusing, and it is easy to imagine that public policy may be misled. The first step in devising a poverty reduction strategy is understanding what these numbers mean, and whether they are useful. Is poverty at unprecedented lows, or has it been stuck at high levels for decades? Both views can’t be right, but they can both be wrong.
What is “Poverty”?
“Poverty” is a word that is banned from the Statistics Canada lexicon. The former Chief Statistician, Ivan Fellegi, made a point of stressing that Canada’s national statistical agency is not in the business of measuring poverty. He counsels that:
there is still no internationally-accepted definition of poverty—unlike measures such as employment, unemployment, gross domestic product, consumer prices, international trade and so on. This is not surprising, perhaps, given the absence of an international consensus on what poverty is and how it should be measured. … The underlying difficulty is due to the fact that poverty is intrinsically a question of social consensus, at a given point in time and in the context of a given country. Someone acceptably well off in terms of the standards in a developing country might well be considered desperately poor in Canada. And even within the same country, the outlook changes over time. A standard of living considered as acceptable in the previous century might well be viewed with abhorrence today. (Fellegi 1999, page 36).
In other words, we should understand poverty to be the minimum level of resources necessary to participate “normally” in society. Money income will be an important component of those resources in a market-based society, but surely not the only component.
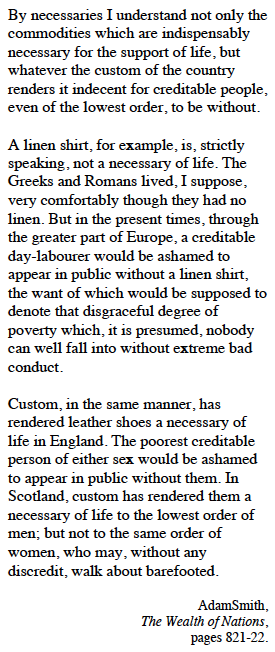
And “normal” is clearly something that will vary across time and place. The best economic theorists who have considered the issue, from Adam Smith writing in 1776 to Amartya Sen writing in 1983, would agree. Dr. Fellegi is absolutely correct when he argues that it is not the statistical agency’s place to explicitly, or even implicitly, embed these kinds of judgements in its numbers. And because poverty cannot be defined in a rigorous and scientifically acceptable way, Statistics Canada should be seen to be in the business of only measuring “low income.”
But it turns out that it is hard for the Agency’s actual practice to live up to the standards it has set for itself, with the result that value judgments are in fact embedded in the “low income” numbers it produces. This is what leads to very different profiles of how poverty has evolved in Canada. In this area of public policy it has been all too easy to harness different numbers in support of competing story-lines. In part, this starts with the understandable demand for a hard number: just how many Canadians are poor?
This is a natural question for a politician to ask as it would give an immediate sense of the scale and salience of the problem. Serving this communication need is the most important purpose of the poverty line. But expressing this need without also being explicit on what sort of financial and non-financial resources should be measured, where to draw the line between poor and non-poor, and how to update that line, puts an unfair onus on official statistics.
So if we are to understand the patterns in the Statistics Canada numbers we need to be clear on just how the Low Income Cut-off and the Low Income Measure are defined. Once that is clear, then we can reflect on how a poverty measure should be defined to serve our policy goals.
What is “The Low Income Measure”?
The poverty rate derived from the Low Income Measure is the fraction of the population with an income lower than one-half of the median income in that year. If an individual has an annual income (appropriately adjusted for family size) that is less than half as much as someone half way in the income distribution, then that individual is considered to be in low income.
It is clearly a statistic based just on money, in no way capturing other dimensions of poverty, whether they be things many of us would consider basic necessities such as an adequate diet, clothing and shelter, or other things that allow us to develop our capabilities and participate fully: a loving and secure family life, access to education, health care, and transportation, or even access to the internet and a cell phone.
Statistics Canada is being true to its values in sticking to income, and not trying to define and measure all these other resources. But in another sense it is not being purely objective, and just as important for our purposes is another value judgment that is hard-wired into this statistic.
What it means to participate normally is assumed to change on an annual basis, from year-to-year as the median income changes. In 2014 the Low Income Measure was $21,773, but this is different for each year as adjustments are made for the annual change in median incomes.
The value judgement embedded in this implies that what it takes to participate normally not only evolves through time, but so rapidly as to change from one year to the next. Among other things, an annual updating could, in principle, lead to the poverty rate falling or not rising very much if the economy goes into a recession. This would happen if the median income falls, something we may well expect as people lose their jobs, unemployment rises, and incomes decline.
This helps explain why cyclical changes in the Low Income Measure are slow and muted. The poverty rate doesn’t go up as sharply during a recession because at the same time median income is lower. As a result the poverty line is adjusted to fall during a recession. This automatically kicks people out of poverty. This is odd. It is reasonable to suggest that the poverty line should be adjusted as what it takes to participate normally evolves. But it is hard to accept that this happens so quickly as to require changes from one year to the next.
What is “The Low Income Cut-off”?
The Low Income Cut-off is a bit more complicated. It is different both in nature, and more crucially in the way it is updated.
In this case the poverty line is tied to the proportion of income the average household spends on food, shelter and clothing. Like the Low Income Measure, it is adjusted annually for changes in inflation, but it has been updated only four times in a more fundamental way to reflect changes in family spending patterns.
The Low Income Cut-off was first published in 1967, when it was based upon 1959 expenditure patterns. At that time the household with an average income spent 50% of its income on food, shelter and clothing. Statistics Canada adds 20% to this, and determines the Low Income Cut-off from the data as the income level associated with the households spending 70% of their income on these necessities.
[As an aside, the reason for this particular mark-up is simply justified as follows: “Twenty percentage points were added to this figure, on the rationale that a family spending over 70% of its income on these essentials would be in “straitened circumstances.” (Cotton, Webber, and Saint-Pierre 1999, page 7) By anchoring the Low Income Cut-off on food, shelter and clothing and marking up these expenditures up by an arbitrarily chosen degree, Statistics Canada drifts away from measuring just income, and takes a stand on what are the necessities of life. In this sense the Low Income Cut-off as originally conceived was a curious mixture of “absolute” and “relative” in nature, the absolute being associated with particular expenditures, and the relative being associated with regular updating.]
There were a series of regular updates reflecting changes in spending patterns. In 1973 the Low Income Cut-off was published using 1969 expenditure patterns; in 1980 using 1978 patterns; in 1987 on the basis of 1986 spending; and finally in 1992 using spending patterns in that year. By 1992 the household with an average income was spending just under 35% of its income on food, shelter and clothing (Cotton, Webber, and Saint-Pierre 1999, pages 23-24).
The updating came to an end for purely pragmatic reasons, and probably political reasons associated with a natural risk aversion among public servants, without any guidance from theory or first principles. The survey that was used to track family expenditures—the appropriately named Family Expenditure Survey—was conducted about every four years or so, but discontinued after collecting information for the last time in 1996.
At that time it was replaced by the Survey of Household Spending, an annual survey that first began collecting information in 1997. The major difference between the two surveys for the purposes of poverty rates is that the shelter cost component of the Survey of Household Spending lumps principal and interest payments of mortgages together. This makes the calculation of shelter costs a more challenging exercise since the Family Expenditure Survey was able to use only the expenditures on interest payments in deriving the Low Income Cut-off. The 1996 Family Expenditure Survey determined that the average proportion of income spent on food, shelter and clothing was 31.9%, but in 1997 was recorded by the Survey of Household Spending to have risen (Cotton, Webber, and Saint-Pierre 1999, Chart 2).
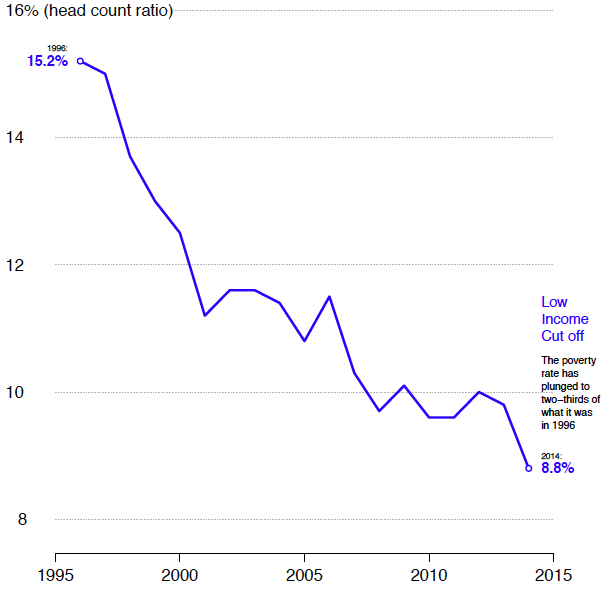
The information in the above picture is adjusted for inflation, but based entirely on 1992 family expenditure patterns. It should be interpreted in the following way: in 1996 15% of Canadians were poor in the sense that they had an income associated with spending a significantly larger fraction on food, shelter and clothing than the average family in 1992. Similarly, in 2014 8.8% were poor in the sense that they too spent a significantly larger fraction of their annual income on necessities than the average 1992 family. That is to say, the 2014 number refers to the material resources necessary to participate normally in the society of 1992, some 22 years in the past before almost all of us had sent our first email.
We should be clear that the Low Income Cut-off, in spite of how it was originally designed, is no longer a relative measure of low income. It is based upon a fixed, not a moving, income threshold using spending patterns in 1992. The Low Income Cut-off we are now using, is the not the same beast as it was when originally conceived, and which Canadians used for the twenty years up to 1992.
The updating of a poverty line represents an important value judgement, and the decision to anchor the Low Income Cut-off is an important change in the meaning of this statistic, one made arbitrarily by Statistics Canada.
Making sense of patterns in the two poverty rates
If poverty is intrinsically a question of social consensus then what value judgment are we asked to agreed to when policy analysts use these statistics?
The patterns in the two statistics can be understood in this way. The median income for an individual was relatively constant from the mid 1970s up to the mid 1990s. In essence the threshold associated with the Low Income Measure did not change that much, and was in the range of the Low Income Cut-Offs, which in turn was anchored at its 1992 base. So the two poverty rates moved together, but the Low Income Measure being less cyclically sensitive because the poverty threshold falls as median incomes fall during recessions.
After about 1996 the two poverty rates diverge because, on the one hand, the poverty line derived from Low Income Cut-Off stays fixed, but that derived from the Low Income Measure rises in step with the annual increases of the median income that started at this time, and more or less continued through to 2014.
These are two very different views of the nature of poverty. If you have a tendency to see poverty as being subsistence, tied to basic needs, and absolute or fixed in nature, then you will be inclined to believe that poverty has fallen, and that there really is not much need for public policy to do more. Though it still has to be explained why your notion of subsistence is tied to spending patterns of the average household in 1992. Why not 1986, 1969, or even 1959?
If you have a tendency to see poverty as an aspect of inequality in the lower part of the income distribution, tied to a continually evolving median income and relative or moving in nature, then you will be inclined to believe that there has been no progress in the battle against poverty, and a government strategy is desperately needed. Though it still has to be explained why your notion of relativities should be adjusted so regularly, and even during recessions when the income of the median household might also fall.
Both of these perspectives are based upon extreme judgements of what it takes to participate normally in society—something never changing, something always changing—and for this reason I would suggest that they are both wrong, have misled our understanding of how Canadians have lived their lives, and are likely to lend confusion to public policy discussion on the need for and design of a national poverty reduction strategy.
[ This post is the first in a two-part series. The second installment presents a policy relevant way to set the poverty line. Both posts are edited excerpts from a forthcoming paper I have written called “‘Inequality is the root of social evil,’ or maybe not? Two stories about inequality and public policy”, which is published in the December 2016 issue of Canadian Public Policy. If you have any feedback please feel free to submit your input in the comments section. ]

2 thoughts on “Understanding what poverty means and how it is measured are the first steps toward a poverty reduction strategy”