
On Thursday, April 9th Statistics Canada will release the results of the Labour Force Survey for the month of March 2020. COVID19 makes this one of the most scrutinized releases in the 75 year history of the survey, reporting as it will on jobs and unemployment during the week of March 15th to March 21st. Here’s what you need to know, and what to look for.

1. As luck has it, the survey is well timed to capture the start of the economic meltdown
The survey is anchored on a particular week of the month, and this conditions the relevance of the statistics for understanding the early fall out of COVID19.
The Labour Force Survey gives a snapshot of labour market activities during what the statisticians call “the reference week,” which is usually the week containing the 15th of the month, stretching from the Sunday to the Saturday. In March 2020 this was the period from Sunday March 15th to Saturday March 21st.
Statistics Canada then went into the field to collect the data for a ten day period from Sunday the 22nd to the following Tuesday, the 31st, asking Canadians about their activities during the reference week. This relatively late collection period explains why the results are being released a bit later than the usual first Friday of the month, the statistical agency needing an extra week to process the data gathering.
In the United States the reference week is a bit earlier, which explains why the Bureau of Labor Statistic releases on the first Friday of the month more regularly. But the timing of the reference week in the US is just before the country started responding to COVID19, so a full picture won’t be available until next month when April numbers in the can.
In a sense the Canadian survey is better placed to get a snapshot of the state of things during a week in which the economic situation in response to COVID19 deteriorated significantly. On the 14th the government began alerting Canadians abroad to travel back to Canada while commercial flights were still available, and Dr. Tam encouraged event organizers to cancel large events, but by mid week social distancing was front and center, a number of provincial governments had closed schools and non essential businesses, and by the 22nd the federal government closed the border.
The labour market probably deteriorated even more during the week after the reference week, so we won’t get a fine-grained picture of what happened in March, but still a reasonably good shot of how things began to unroll.
2. We need to interpret the unemployment rate with supplementary indicators to round out the picture
The unemployment rate will surely be a headline number, as it is with every release, but it helps to remind ourselves of Statistics Canada’s definition so that we can appreciate what it tells us, and what else we might need to know.
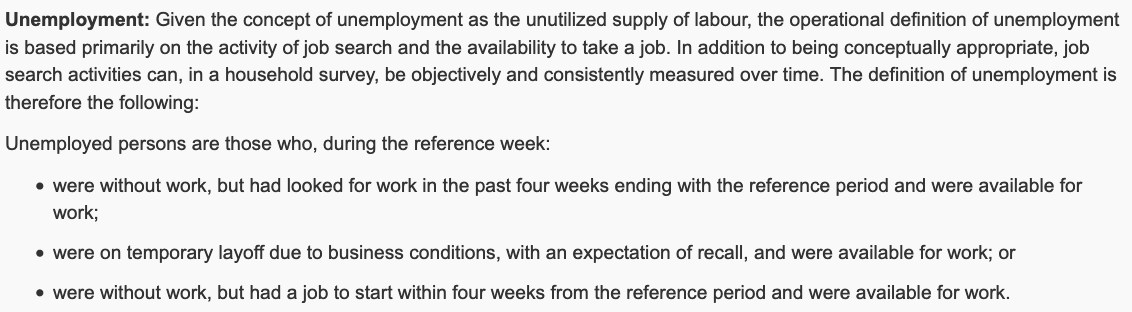
The corner stone of this definition is the job search requirement. To be considered unemployed the survey respondent must not have been employed, available for work, and have done something—actively or passively— to look for a job during the past four weeks.
So two important things. First, this has nothing to do with Employment Insurance, and that is a good thing. If we relied on a government program for our measure of unemployment, then administrative changes to the rules governing program eligibility or generosity will change our measurement of the under utilization of human potential. Don’t expect the unemployment numbers to change in the same way as new Employment Insurance claims.
Second, during COVID19 we can expect job search to dramatically fall, both among those who were already unemployed and those starting an unemployment spell. There are no jobs to be had, that is pretty clear in the face of government mandated shutdowns, even if some industries and employers are looking to hire.
So this is one reason to expect the unemployment numbers not to fully capture the devastation, though strictly speaking the question refers to job search activities during the previous four weeks. It might be helpful to look to supplementary measures of unemployment that include “discouraged workers.”
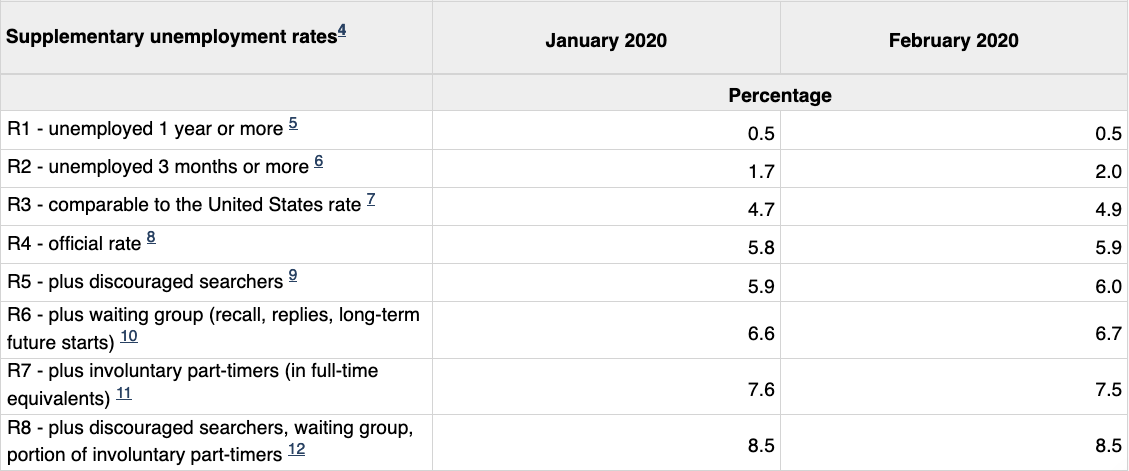
In fact, last month there were not that many discouraged workers, and a supplementary statistic that includes them was very close to the official unemployment rate. But the official unemployment rate is only one of eight statistics produced, with R8 being the most comprehensive measure.
This statistic stood at 8.5% in February, compared to the official rate at 5.9%. Look for the gap between these numbers to widen with the March release as the number of Canadians laid off and not looking for working but expecting to be recalled likely soars. The number that continue to be employed but working much fewer hours will also likely rise. R8 captures both of these and other groups. It should increase more than the unemployment rate does.
[Remember, working for only one hour in an employer-employee relationship during the reference week is enough to get a survey respondent classified as “employed” even if there was a drastic cut back in their hours of work. So including involuntary part-time employment numbers in R8 is a good thing to capture what may have happened during the March 2020 reference week.]
The definition of unemployment is more nuanced. Those on temporary layoff with an expectation of recall don’t have to search, and this will contribute to the unemployment numbers, but those who were not looking because they expected to start a job will evaporate from the totals.
All this implies that “reasons for unemployment” will be a particularly relevant part of the adjustment to COVID19, and in particular the distinction between those permanently laid-off versus those temporarily laid-off. This will give us a sense of the potential reach of the federal government’s wage subsidy program to businesses, small and large. If permanent layoffs rise way more than temporary, then we might suspect that this program is closing the barn door after everyone has been pushed out.
Also if permanent layoffs increase strongly, this signals a much more protracted labour market recession, and the expectation of a slower recovery. Those on temporary layoff with an expectation of recall have the shortest unemployment spells, those on permanent layoff have longer spells, and those with an expectation of recall that turns out to be incorrect longer still.
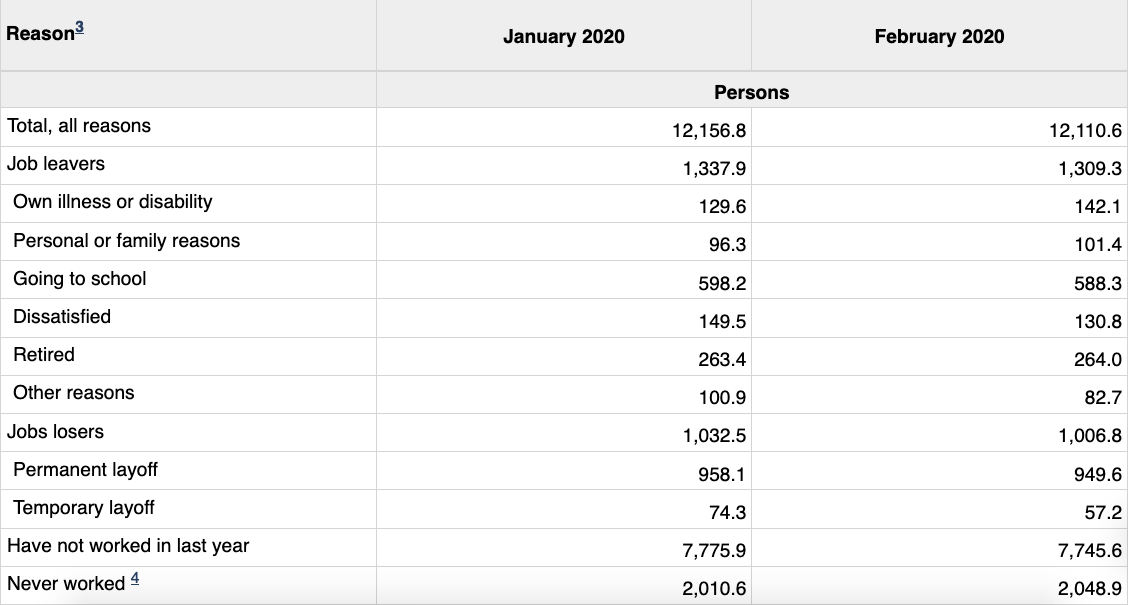
Last month there were about 1 million individuals who said they were without work (whether or not they were looking for work) because they lost their job, but only 57,000 were on temporary layoff. We might expect the temporary numbers to show a big jump, even during the first week of COIVD19.
But there are other reasons for not having a job that may directly influence the signal the unemployment rate will be sending us.
We can reasonably expect illness, care-giving, and other family reasons for leaving a job to increase, and to the extent that these individuals are not looking for work, they will be considered “not in the labour force” as opposed to being counted among the unemployed. So also look for these numbers to supplement the unemployment picture.
3. The labour market is dynamic with very large gross flows into and out of unemployment and employment determining the net change in these numbers
The duration of unemployment and employment spells helps us to understand why the unemployment rate changes in the way it does.
A slow down in the rate of hiring is the usual pattern at the onset of a recession, making it harder for those who are unemployed to move to employment, or for new entrants or re-entrants—like students—to find a job. This will surely happen this time round in a big way, and government programs to date have not been tailored to this group.
To get an accurate sense of the magnitude of the flow from unemployment into employment is difficult with the data Statistics Canada makes readily available, but you can get a rough proxy by looking at job tenure. What will happen to the number of people who just started a job, those with a tenure of one to three months being the shortest category in the publicly available numbers?
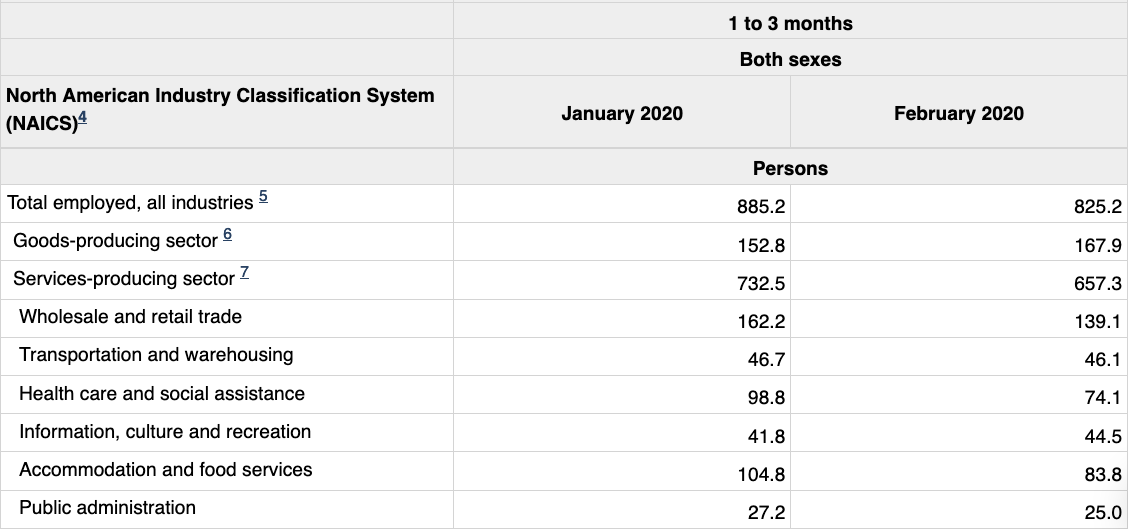
This is not going to be a perfect measure of how tight the tap flowing from unemployment to to employment has been shut by COVID19, but it will go part of the way in giving us a sense of how the flows are changing, particularly if we look at it by industry.
And then there is the flip side, the flow from employment into unemployment, which can be roughly proxied by the the number of unemployed that just started a spell of unemployment. The finest information that Statistics Canada will give us is the number of unemployed who have been unemployed for four weeks or less.
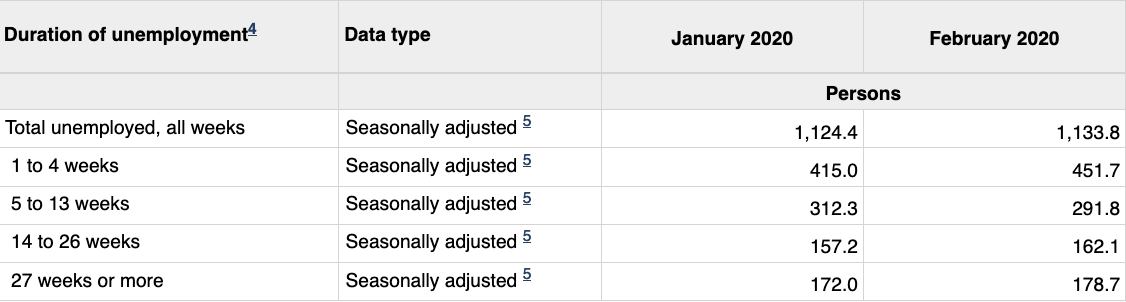
But we will also likely see a significant fall in job finding rates for all the unemployed, with a significant increase in the duration of unemployment among those who have already been unemployed for some time. But ironically, the average duration of unemployment will likely fall, because it measures incomplete spells, and the pool of the unemployed may be dominated by a larger share of people who just started a spell.
So look for a chunk of those who had been unemployed 14 to 26 weeks in February to be classified as being unemployed for 27 weeks or more in March as their job finding rates plummet. If they don’t show up here it is because they stopped looking for work, no longer counted as unemployed and considered as discouraged workers. The burden of unemployment, the social costs of it, are often associated with the length of time spent unemployed, six months or longer being a marker of a particularly long spell.
4. Take a closer look at the numbers
You can use an app I’ve developed to help you visualize some of these data, which are downloaded from the publicly available Statistics Canada tables that I use in this post. This dashboard allows you to look at information for each of the provinces and for different demographic groups.
https://milescorak.shinyapps.io/JobsAndUnemployment/
Use the tabs across the top of the dashboard to focus on either Employment or on Unemployment, and then use the left panel to choose a statistic and time period, as well as geographic and demographic breakdowns. Hover over the images to see specific data values.
[The hosting is a bit slow and tempermental, so be patient, and certainly any suggestions for improvement would be appreciated.]

One thought on “What you need to know about Statistics Canada’s survey of the labour market”