
The Fraser Institute has weighed in on the income inequality debate with a report called “Income inequality: measurement sensitivities” that reviews the statistical measurement of income inequality in Canada.
The report quite rightly points out that there are many nuances in the measurement of income, and income inequality, and that the results vary substantially depending upon how economists and statisticians deal with them. Is income measured by earnings, or by total income that includes not just business and investment income but also government transfers? Should it be measured before or after taxes? And should we be looking at total family income or try to represent this as individual income by accounting for family size?
The analysis is carefully done and clearly presented, and though it covers ground that is pretty well standard for many economists working in this area, it helps to clarify the issues for a broader audience.
But the study concludes, in the words of the screaming press release, that there is “No income inequality crisis in Canada when it’s properly measured.”
That is the wrong inference to be making. What the study is missing is a coherent understanding of the link the different measures it so accurately calculates. As a result it misses important policy lessons.
The authors feel that readers need to choose between the different measures of inequality, as if one number, the “best” number, can steer us through this complexity to the correct policy inference.
Rather, we should keep in mind that together these statistics paint a picture that help, rather than hinder, our thinking about why inequality should be a concern.
Here’s what I see in this picture:
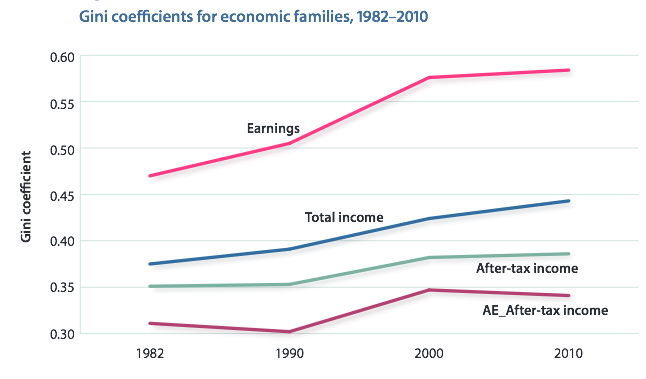
1. The distinct rise in earnings inequality tells us that the labour market is a much more polarized place than it was three decades ago, and the clear winners have been those in the top 10% of the earnings distribution. For public policy we should wonder about why this has happened, and recognize that these forces—associated with globalization, the computer revolution, and corporate governance—are not going to go away. These trends influence all sorts of individual decisions from whether to work or not, how much education to get, when to buy a home, marry and have a baby, and ultimately the capacity to be self-sufficient.
2. Public policy—in the way of a progressive tax and transfer system—has played an important role in buffering families from these forces. The after tax- after transfer level of inequality is much lower than earnings inequality alone. We should at once celebrate this important role of the public sector in supporting families, but also recognize its limits. In fact, the impact of the tax-transfer system on inequality was much more muted after the mid 1990s. There is an important policy agenda here: to evaluate any current changes in terms of how progressive they are, and to redesign policy for the longer term in an era appropriate for a more polarized labour market.
3. Families are crucial, and Canadian families have adjusted and changed to these realities in important ways. They have become more educated, they have become smaller, they work harder, and women in particular have played a central role in all this. All these demographic changes are a response to economic realities and growing inequalities, and they have been important in mitigating the influence of a more polarized labour market. But they can’t carry all this weight, and the family fabric can be stretched only so far until labour market realities are shadowed into the realities of family life. Which makes intelligent policy all the more important because families are the ultimate source of support for the next generation.
The Fraser Institute study is a nicely crafted piece of statistics, but we need a vision to make sense of the numbers and more importantly to guide public policy. Otherwise we fall into a trap of thinking complexity is something that should stop further thinking, or something that has to be simplified by choosing just one number. How much easier the policy-makers life would be if we just chose the number showing us that inequality hasn’t increased?
Inequality may be complex, but that doesn’t mean we can’t make sense of it.

Reblogged this on Multicultural Meanderings and commented:
As always, worth reading.